 341d9e05a8
* Add temporal graph evolution & RuVector integration research GOAP Agent 8 output: 1,528-line SOTA research document covering temporal graph models (TGN, JODIE, DyRep), RuVector graph memory design, mincut trajectory tracking with Kalman filtering, event detection pipelines, compressed temporal storage, cross-room transition graphs, and a 5-phase integration roadmap. Part of RF Topological Sensing research swarm (10 agents). https://claude.ai/code/session_01DGUAowNScGVp88bK2eiuRv * Add transformer architectures for graph sensing research GOAP Agent 4 output: 896-line SOTA document covering Graph Transformers (Graphormer, SAN, GPS, TokenGT), Temporal Graph Transformers (TGN, TGAT, DyRep), ViT for RF spectrograms, transformer-based mincut prediction, positional encoding for RF graphs, foundation models for RF sensing, and efficient edge deployment with INT8 quantization. Part of RF Topological Sensing research swarm (10 agents). https://claude.ai/code/session_01DGUAowNScGVp88bK2eiuRv * Add attention mechanisms for RF sensing research GOAP Agent 3 output: 1,110-line document covering GAT for RF graphs, self-attention for CSI sequences, cross-attention multi-link fusion, attention-weighted differentiable mincut, spatial node attention, antenna-level subcarrier attention, and efficient attention variants (linear, sparse, LSH, S4/Mamba). 8 ASCII architecture diagrams. Part of RF Topological Sensing research swarm (10 agents). https://claude.ai/code/session_01DGUAowNScGVp88bK2eiuRv * Add sublinear mincut algorithms research GOAP Agent 5 output: 698-line document covering classical mincut complexity, sublinear approximation (sampling, sparsifiers), dynamic mincut with lazy recomputation hybrid, streaming sketch algorithms, Benczur-Karger sparsification, local partitioning (PageRank-guided cuts), randomized methods reliability analysis, and Rust implementation with const-generic RfGraph, zero-alloc Stoer-Wagner, SIMD batch updates. Part of RF Topological Sensing research swarm (10 agents). https://claude.ai/code/session_01DGUAowNScGVp88bK2eiuRv * Add CSI edge weight computation research GOAP Agent 2 output: ~700-line document covering CSI feature extraction, coherence metrics (cross-correlation, mutual information, phasor coherence), multipath stability scoring (MUSIC, ESPRIT, ISTA), temporal windowing (EMA, Welford, Kalman), noise robustness (phase noise, AGC, clock drift), edge weight normalization, and implementation architecture showing 32KB memory for 120 edges within ESP32-S3 capability. Part of RF Topological Sensing research swarm (10 agents). https://claude.ai/code/session_01DGUAowNScGVp88bK2eiuRv * Add contrastive learning for RF coherence research GOAP Agent 7 output: 1,226-line document covering SimCLR/MoCo/BYOL for CSI, AETHER-Topo dual-head extension, coherence boundary detection with multi-scale analysis, delta-driven updates (2-12x efficiency), self-supervised pre-training protocol, triplet networks for 5-state edge classification, and MERIDIAN cross-environment transfer with EWC continual learning. Part of RF Topological Sensing research swarm (12 agents). https://claude.ai/code/session_01DGUAowNScGVp88bK2eiuRv * Add resolution and spatial granularity analysis research GOAP Agent 9 output: 1,383-line document covering Fresnel zone analysis, node density vs resolution (16-node/5m room → 30-60cm), Cramer-Rao lower bounds with Fisher Information Matrix, graph cut resolution theory, multi-frequency enhancement (6cm coherent dual-band limit), RF tomography comparison, experimental validation protocols, and resolution scaling laws (8.8cm theoretical limit). Part of RF Topological Sensing research swarm (12 agents). https://claude.ai/code/session_01DGUAowNScGVp88bK2eiuRv * Add RF graph theory and minimum cut foundations research GOAP Agent 1 output: Graph-theoretic foundations covering max-flow/min-cut for RF (Ford-Fulkerson, Stoer-Wagner, Karger), RF as dynamic graph with CSI coherence weights, topological change detection via Fiedler vector and Cheeger inequality, dynamic graph algorithms, comparison to classical RF sensing, formal mathematical framework, and 9 open research questions. Part of RF Topological Sensing research swarm (12 agents). https://claude.ai/code/session_01DGUAowNScGVp88bK2eiuRv * Add ESP32 mesh hardware constraints research GOAP Agent 6 output: ESP32 CSI capabilities (52/114 subcarriers), 16-node mesh topology with 120 edges, TDM synchronized sensing (3ms slots), computational budget (Stoer-Wagner uses 0.07% of one core), channel hopping, power analysis (0.44W/node), dual-core firmware architecture, and edge vs server computing with 100x data reduction on-device. Part of RF Topological Sensing research swarm (12 agents). https://claude.ai/code/session_01DGUAowNScGVp88bK2eiuRv * Add system architecture and prototype design research GOAP Agent 10 output: End-to-end architecture with pipeline diagrams, existing crate integration mapping, new rf_topology module design (DDD aggregate roots), 100ms latency budget breakdown, 3-phase prototype plan (4-node POC → 16-node room → 72-node multi-room), benchmark design with 8 metrics, ADR-044 draft, and Rust trait definitions (EdgeWeightComputer, TopologyGraph, MinCutSolver, BoundaryInterpolator). Part of RF Topological Sensing research swarm (12 agents). https://claude.ai/code/session_01DGUAowNScGVp88bK2eiuRv * Add quantum sensing and quantum biomedical research documents Agent 11: Quantum-level sensors (729 lines) — NV centers, SQUIDs, Rydberg atoms, quantum illumination, quantum graph theory (walks, spectral, QAOA), hybrid classical-quantum architecture, quantum ML (VQC, kernels, reservoir computing), NISQ applications (D-Wave, VQE), hardware roadmap. Agent 12: Quantum biomedical sensing (827 lines) — whole body biomagnetic mapping, neural field imaging without electrodes, circulation sensing, cellular EM signaling, non-contact diagnostics, coherence-based diagnostics (disease as coherence breakdown), neural interfaces, multimodal observatory, room-scale ambient health monitoring, graph-based biomedical analysis. Part of RF Topological Sensing research swarm (12 agents). https://claude.ai/code/session_01DGUAowNScGVp88bK2eiuRv * Add research index synthesizing all 12 documents (14,322 lines) Master index for RF Topological Sensing research compendium covering: graph theory foundations, CSI edge weights, attention mechanisms, transformers, sublinear algorithms, ESP32 hardware, contrastive learning, temporal graphs, resolution analysis, system architecture, quantum sensors, and quantum biomedical sensing. Includes key findings, proposed ADRs (044, 045), and 5-phase implementation roadmap. https://claude.ai/code/session_01DGUAowNScGVp88bK2eiuRv * Add SOTA neural decoding landscape and 10 application domains research - Doc 21: Comprehensive SOTA map (2023-2026) of brain sensors, decoders, and visualization systems with RuVector/mincut positioning analysis - Doc 22: Ten application domains for brain state observatory including disease detection, BCI, cognitive monitoring, mental health diagnostics, neurofeedback, dream reconstruction, cognitive research, HCI, wearables, and brain network digital twins with strategic roadmap https://claude.ai/code/session_01DGUAowNScGVp88bK2eiuRv * Add NV diamond neural magnetometry research document (13/22) Comprehensive 600+ line document covering NV center physics, neural magnetic field sources, sensor architecture, SQUID comparison, signal processing pipeline, RuVector integration, and development roadmap. https://claude.ai/code/session_01DGUAowNScGVp88bK2eiuRv * Add ruv-neural workspace Cargo.toml with 12 crate definitions Workspace structure for the rUv Neural brain topology analysis system. 12 mix-and-match crates with shared dependencies including RuVector integration, petgraph, rustfft, and WASM/ESP32 support. https://claude.ai/code/session_01DGUAowNScGVp88bK2eiuRv * Add ruv-neural crate ecosystem — 12 mix-and-match crates (WIP) Initial implementation of the rUv Neural brain topology analysis system: - ruv-neural-core: Core types, traits, errors, RVF format (compiles) - ruv-neural-sensor: NV diamond, OPM, EEG sensor interfaces (in progress) - ruv-neural-signal: DSP, filtering, spectral, connectivity (in progress) - ruv-neural-graph: Brain connectivity graph construction (in progress) - ruv-neural-mincut: Dynamic minimum cut topology analysis (in progress) - ruv-neural-embed: RuVector graph embeddings (in progress) - ruv-neural-memory: Persistent neural state memory + HNSW (compiles) - ruv-neural-decoder: Cognitive state classification + BCI (in progress) - ruv-neural-esp32: ESP32 edge sensor integration (compiles) - ruv-neural-wasm: WebAssembly browser bindings (in progress) - ruv-neural-viz: Visualization + ASCII rendering (in progress) - ruv-neural-cli: CLI tool (in progress) Agents still writing remaining modules. Next: fix compilation, tests, push. https://claude.ai/code/session_01DGUAowNScGVp88bK2eiuRv * Fix ruv-neural crate compilation: all 12 crates build and 1200+ tests pass - Fix node2vec.rs type inference error (Vec<_> → Vec<Vec<f64>>) - Fix artifact.rs with full filter-based detection implementations - Fix signal crate ConnectivityMetric re-export and trait method names - Fix embed crate EmbeddingGenerator trait implementations - Complete spectral, topology, and node2vec embedders with tests - Complete preprocessing pipeline with sequential stage processing - All workspace crates compile cleanly, 0 test failures https://claude.ai/code/session_01DGUAowNScGVp88bK2eiuRv * Add ruv-neural-cli README https://claude.ai/code/session_01DGUAowNScGVp88bK2eiuRv * fix: convert desktop icons from RGB to RGBA for Tauri build Tauri's generate_context!() macro requires RGBA PNG icons. All 5 icon files (32x32.png, 128x128.png, 128x128@2x.png, icon.icns, icon.ico) were RGB-only, causing a proc macro panic on Linux builds. Fixes #200 Co-Authored-By: claude-flow <ruv@ruv.net> * Add Subcarrier Manifold and Vitals Oracle modules for 3D visualizations - Implemented Subcarrier Manifold to visualize amplitude data as a 3D surface with height and age attributes. - Created Vitals Oracle to represent vital signs using toroidal rings and particle trails, incorporating breathing and heart rate dynamics. - Both modules utilize Three.js for rendering and include custom shaders for visual effects. * feat: complete ruv-neural implementation — physics models, security, witness verification Replace all stubs/mocks with production physics-based signal models: - NV Diamond: ODMR Lorentzian dip, 1/f pink noise (Voss-McCartney), brain oscillations - OPM: SERF-mode, 50/60Hz powerline harmonics, full cross-talk compensation via Gaussian elimination with partial pivoting - EEG: 5 frequency bands, eye blink artifacts (Fp1/Fp2), muscle artifacts, impedance-based thermal noise floor - ESP32 ADC: ring-buffer reader with calibration signal generator, i16 clamp Security hardening (SEC-001 through SEC-005): - RVF bounded allocation (16MB metadata, 256MB payload) - sample_rate validation (>0, finite) - Signal NaN/Inf rejection - ADC resolution_bits overflow clamp - HNSW HashSet visited tracking + bounds checks Performance optimizations (PERF-001 through PERF-005): - 67x fewer FFTs via pre-computed analytic signals - VecDeque O(1) eviction in memory store - Thread-local FFT planner caching - BrainGraph::validate() for edge/weight integrity - Eigenvalue convergence early termination Ed25519 witness verification system: - 41 capability attestations across all 12 crates - SHA-256 digest + Ed25519 signature - CLI commands: `witness --output` and `witness --verify` README: ethics warning, hardware parts list (AliExpress), assembly instructions Co-Authored-By: claude-flow <ruv@ruv.net> * docs: add crates.io badges and install instructions to ruv-neural README Add version badges linking to each published crate on crates.io, cargo add instructions, and crate search link in the Crate Map table. Co-Authored-By: claude-flow <ruv@ruv.net> --------- Co-authored-by: Claude <noreply@anthropic.com> |
||
|---|---|---|
| .. | ||
| src | ||
| LICENSE | ||
| README.md | ||
| package.json | ||

README.md
debug


A tiny JavaScript debugging utility modelled after Node.js core's debugging technique. Works in Node.js and web browsers.
Installation
$ npm install debug
Usage
debug exposes a function; simply pass this function the name of your module, and it will return a decorated version of console.error for you to pass debug statements to. This will allow you to toggle the debug output for different parts of your module as well as the module as a whole.
Example app.js:
var debug = require('debug')('http')
  , http = require('http')
  , name = 'My App';

// fake app

debug('booting %o', name);

http.createServer(function(req, res){
  debug(req.method + ' ' + req.url);
  res.end('hello\n');
}).listen(3000, function(){
  debug('listening');
});

// fake worker of some kind

require('./worker');
Example worker.js:
var a = require('debug')('worker:a')
  , b = require('debug')('worker:b');

function work() {
  a('doing lots of uninteresting work');
  setTimeout(work, Math.random() * 1000);
}

work();

function workb() {
  b('doing some work');
  setTimeout(workb, Math.random() * 2000);
}

workb();
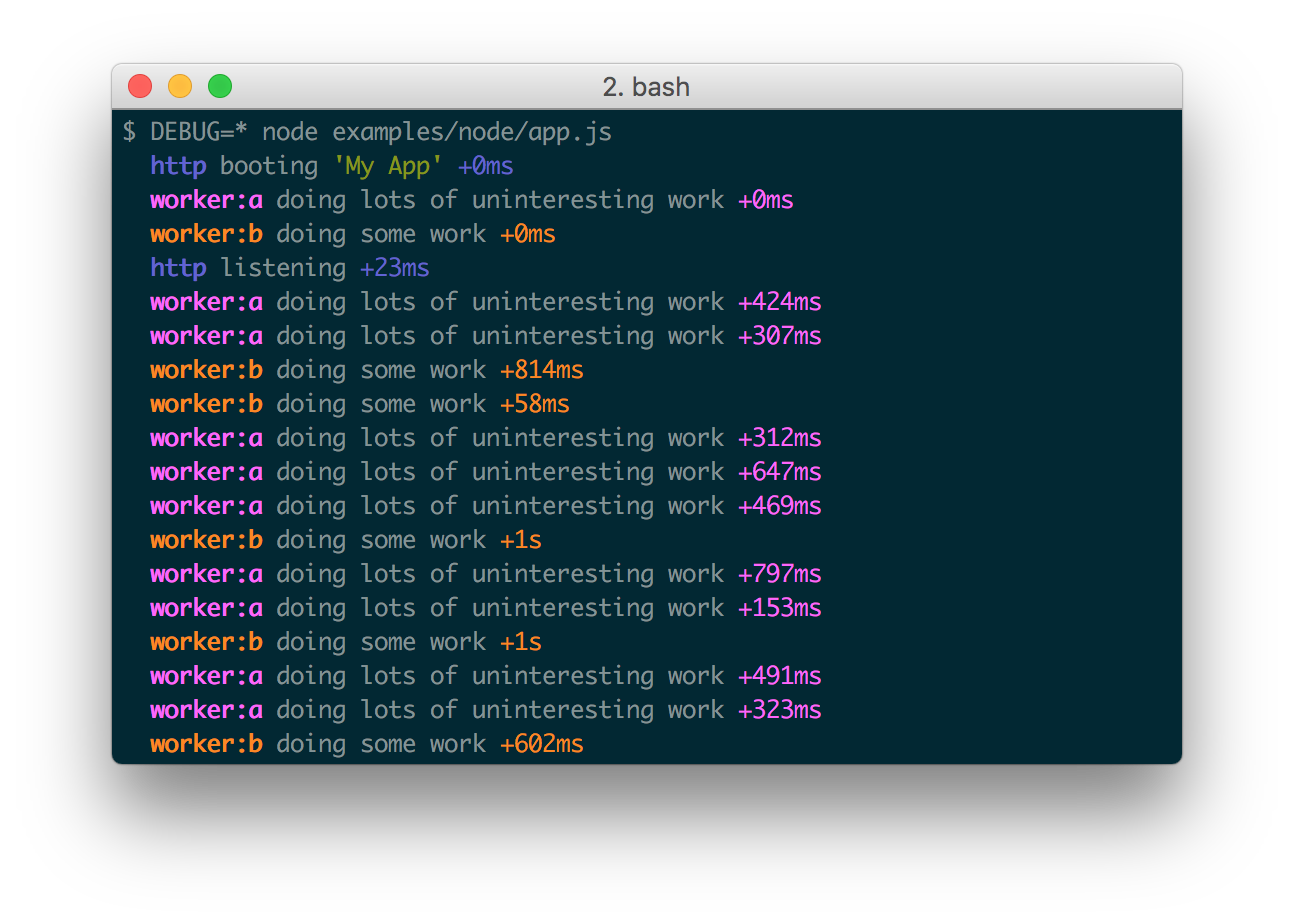
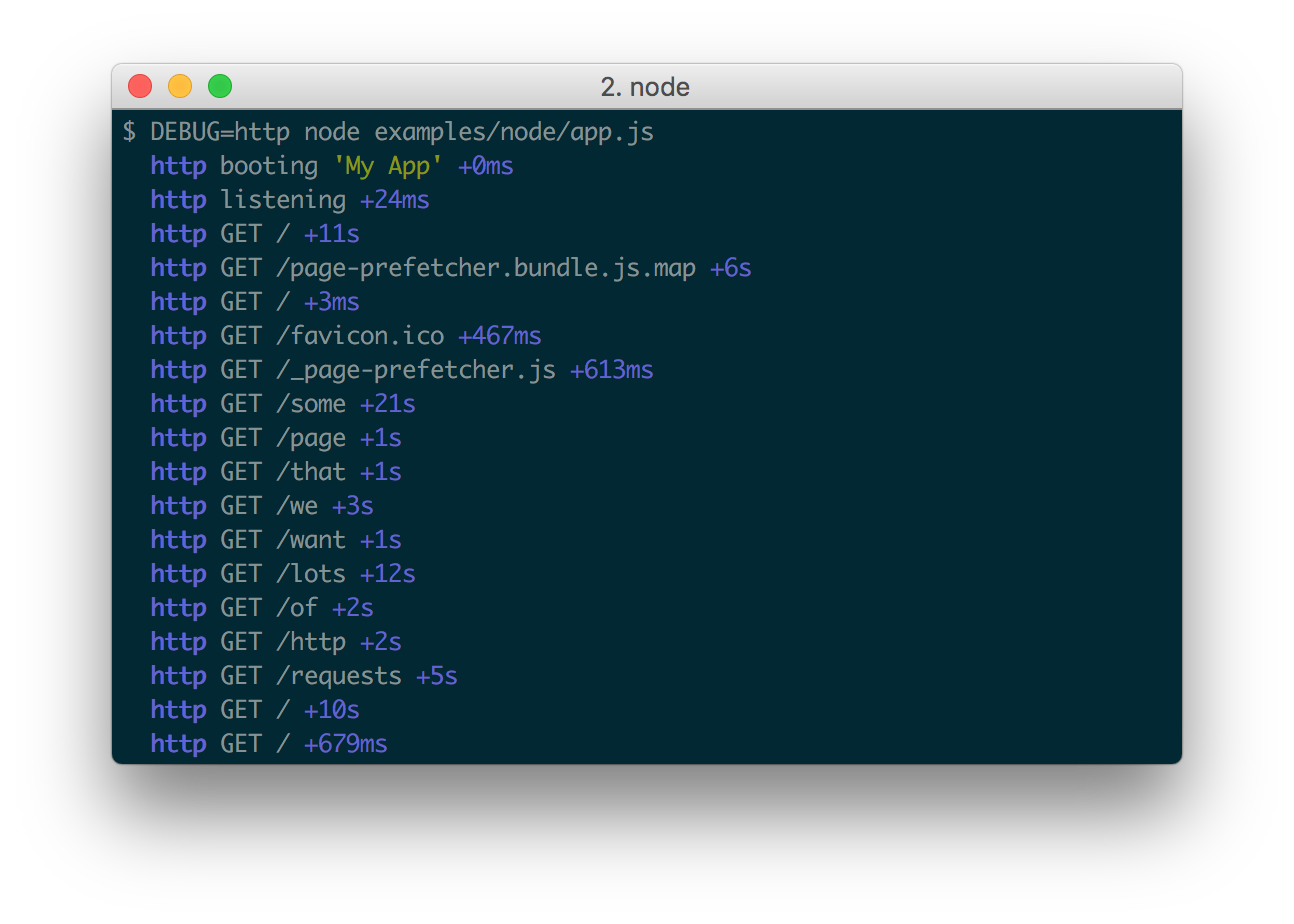
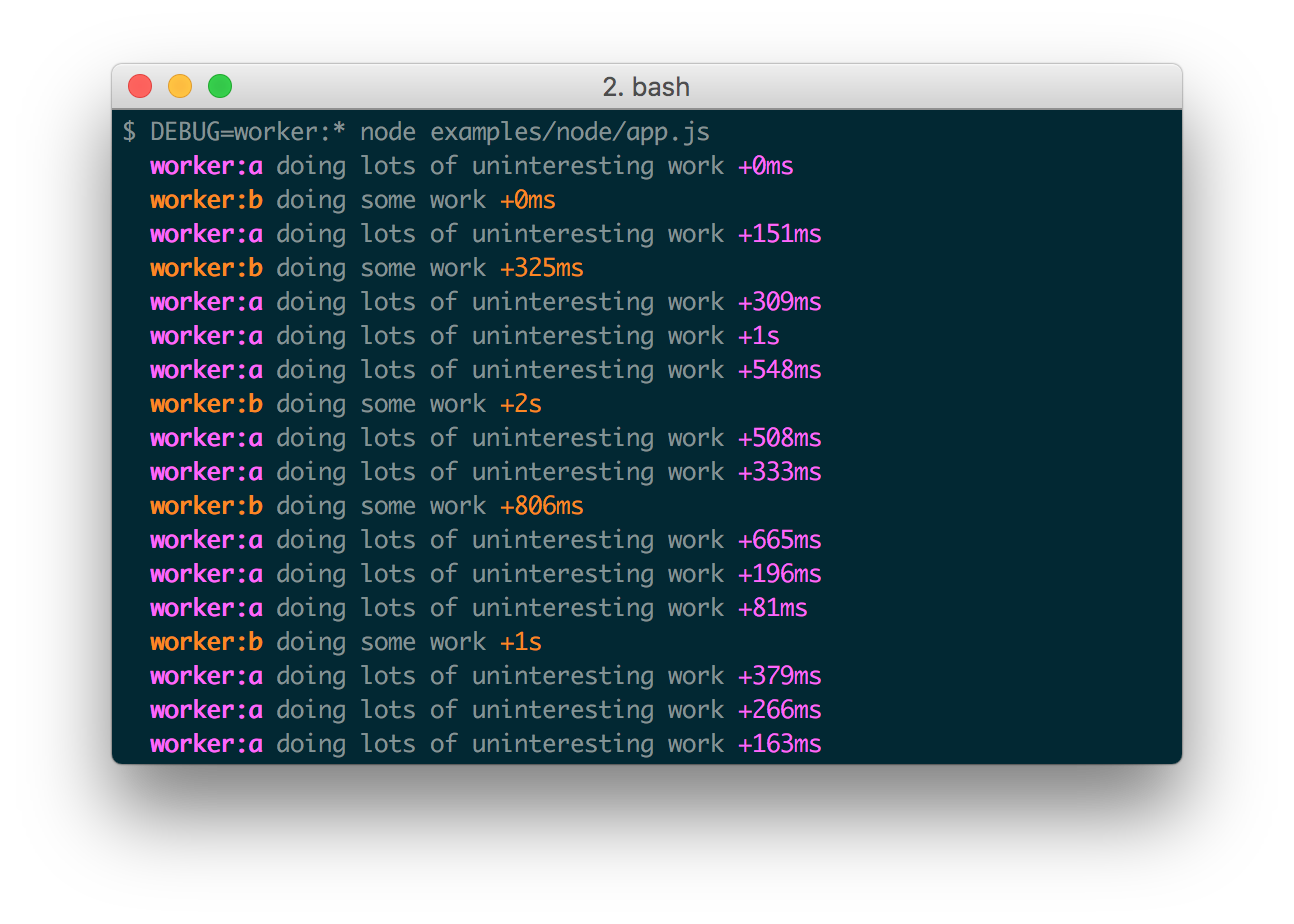
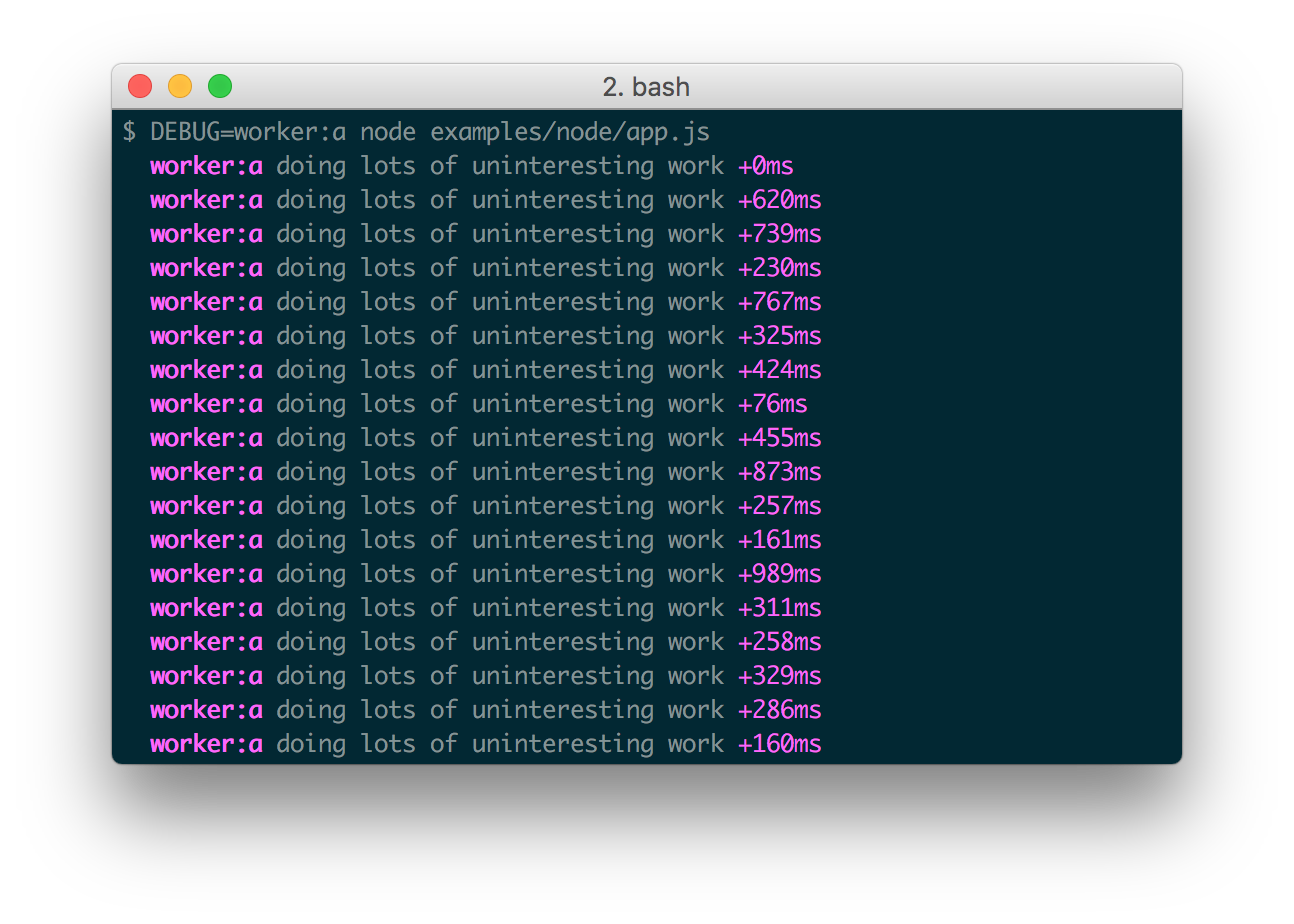
The DEBUG environment variable is then used to enable these based on space or
comma-delimited names.
Here are some examples:
Windows command prompt notes
CMD
On Windows the environment variable is set using the set command.
set DEBUG=*,-not_this
Example:
set DEBUG=* & node app.js
PowerShell (VS Code default)
PowerShell uses different syntax to set environment variables.
$env:DEBUG = "*,-not_this"
Example:
$env:DEBUG='app';node app.js
Then, run the program to be debugged as usual.
npm script example:
"windowsDebug": "@powershell -Command $env:DEBUG='*';node app.js",
Namespace Colors
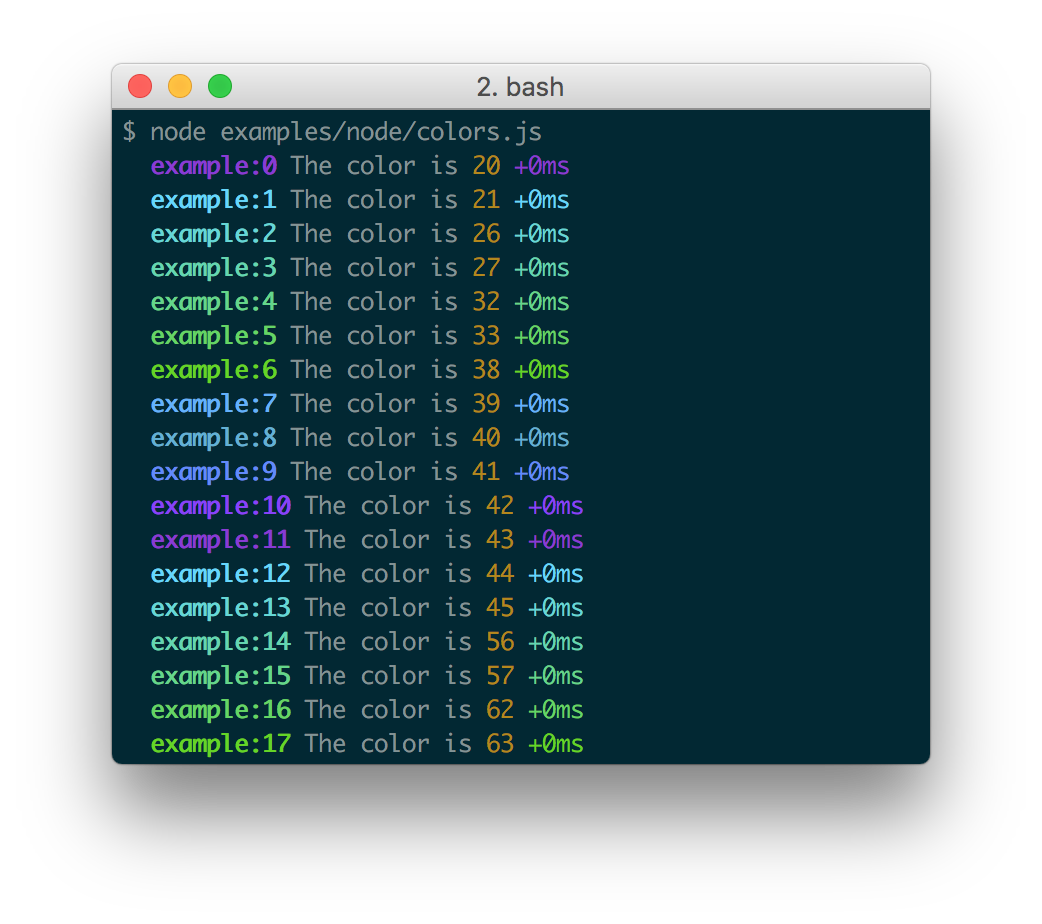
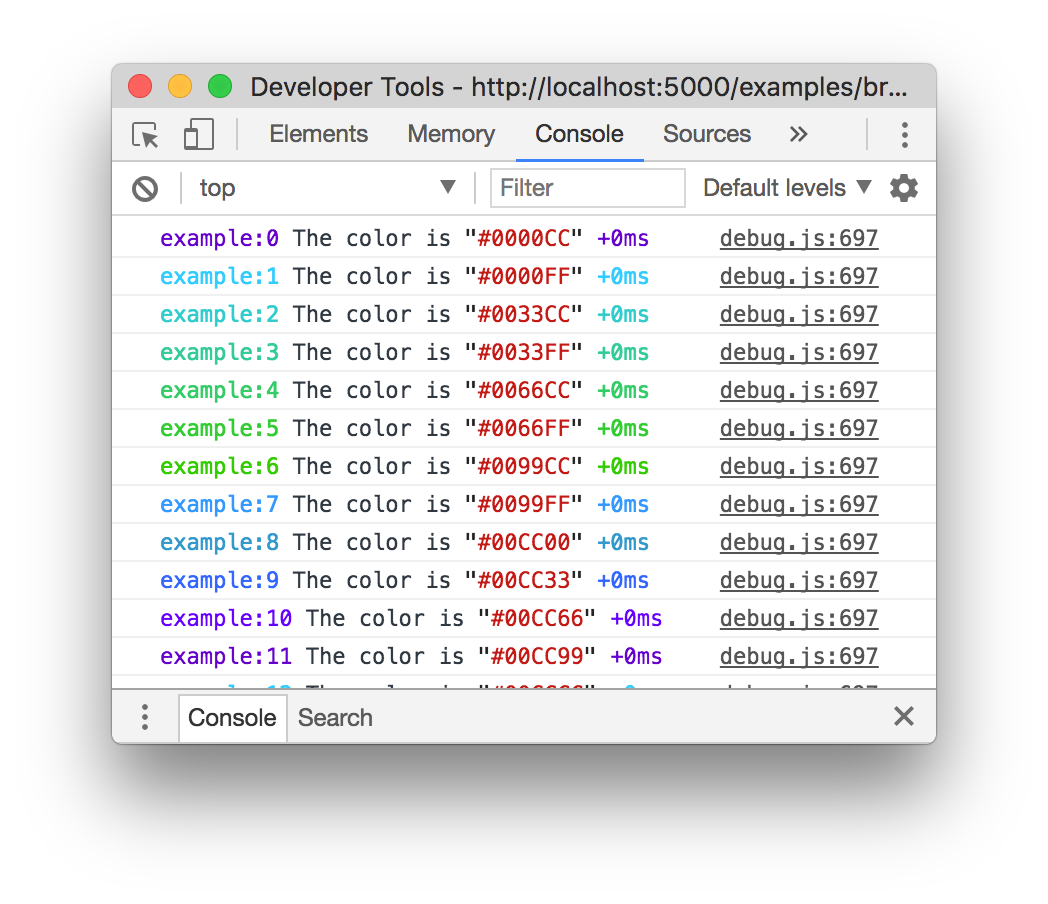
Every debug instance has a color generated for it based on its namespace name. This helps when visually parsing the debug output to identify which debug instance a debug line belongs to.
Node.js
In Node.js, colors are enabled when stderr is a TTY. You also should install
the supports-color module alongside debug,
otherwise debug will only use a small handful of basic colors.
Web Browser
Colors are also enabled on "Web Inspectors" that understand the %c formatting
option. These are WebKit web inspectors, Firefox (since version
31)
and the Firebug plugin for Firefox (any version).
Millisecond diff
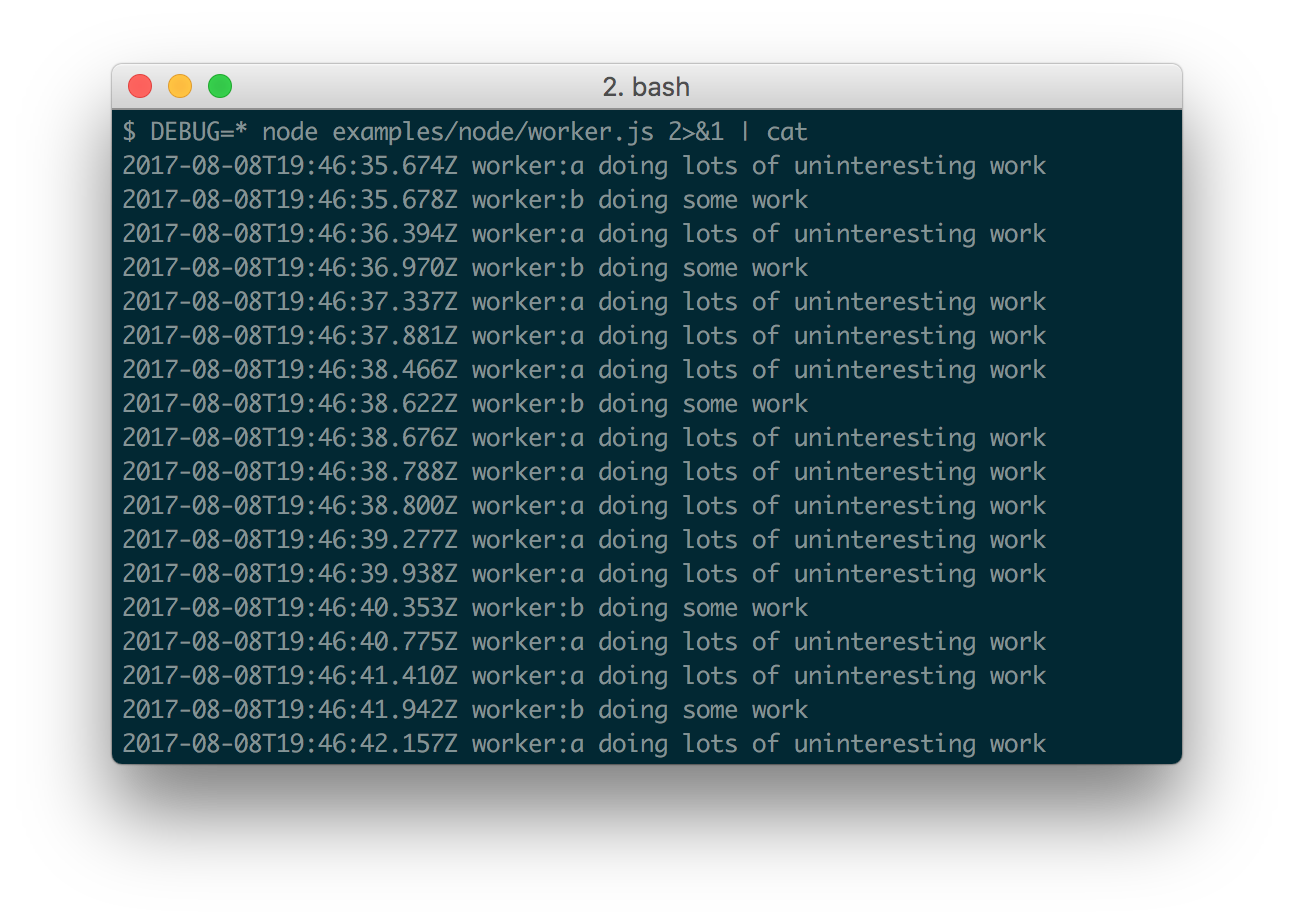
When actively developing an application it can be useful to see when the time spent between one debug() call and the next. Suppose for example you invoke debug() before requesting a resource, and after as well, the "+NNNms" will show you how much time was spent between calls.
When stdout is not a TTY, Date#toISOString() is used, making it more useful for logging the debug information as shown below:
Conventions
If you're using this in one or more of your libraries, you should use the name of your library so that developers may toggle debugging as desired without guessing names. If you have more than one debuggers you should prefix them with your library name and use ":" to separate features. For example "bodyParser" from Connect would then be "connect:bodyParser". If you append a "*" to the end of your name, it will always be enabled regardless of the setting of the DEBUG environment variable. You can then use it for normal output as well as debug output.
Wildcards
The * character may be used as a wildcard. Suppose for example your library has
debuggers named "connect:bodyParser", "connect:compress", "connect:session",
instead of listing all three with
DEBUG=connect:bodyParser,connect:compress,connect:session, you may simply do
DEBUG=connect:*, or to run everything using this module simply use DEBUG=*.
You can also exclude specific debuggers by prefixing them with a "-" character.
For example, DEBUG=*,-connect:* would include all debuggers except those
starting with "connect:".
Environment Variables
When running through Node.js, you can set a few environment variables that will change the behavior of the debug logging:
| Name | Purpose |
|---|---|
DEBUG |
Enables/disables specific debugging namespaces. |
DEBUG_HIDE_DATE |
Hide date from debug output (non-TTY). |
DEBUG_COLORS |
Whether or not to use colors in the debug output. |
DEBUG_DEPTH |
Object inspection depth. |
DEBUG_SHOW_HIDDEN |
Shows hidden properties on inspected objects. |
Note: The environment variables beginning with DEBUG_ end up being
converted into an Options object that gets used with %o/%O formatters.
See the Node.js documentation for
util.inspect()
for the complete list.
Formatters
Debug uses printf-style formatting. Below are the officially supported formatters:
| Formatter | Representation |
|---|---|
%O |
Pretty-print an Object on multiple lines. |
%o |
Pretty-print an Object all on a single line. |
%s |
String. |
%d |
Number (both integer and float). |
%j |
JSON. Replaced with the string '[Circular]' if the argument contains circular references. |
%% |
Single percent sign ('%'). This does not consume an argument. |
Custom formatters
You can add custom formatters by extending the debug.formatters object.
For example, if you wanted to add support for rendering a Buffer as hex with
%h, you could do something like:
const createDebug = require('debug')
createDebug.formatters.h = (v) => {
  return v.toString('hex')
}

// …elsewhere
const debug = createDebug('foo')
debug('this is hex: %h', new Buffer('hello world'))
//   foo this is hex: 68656c6c6f20776f726c6421 +0ms
Browser Support
You can build a browser-ready script using browserify, or just use the browserify-as-a-service build, if you don't want to build it yourself.
Debug's enable state is currently persisted by localStorage.
Consider the situation shown below where you have worker:a and worker:b,
and wish to debug both. You can enable this using localStorage.debug:
localStorage.debug = 'worker:*'
And then refresh the page.
a = debug('worker:a');
b = debug('worker:b');

setInterval(function(){
  a('doing some work');
}, 1000);

setInterval(function(){
  b('doing some work');
}, 1200);
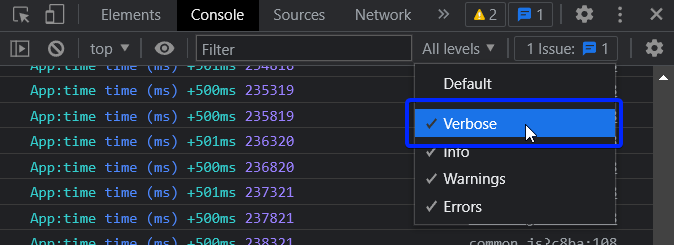
In Chromium-based web browsers (e.g. Brave, Chrome, and Electron), the JavaScript console will—by default—only show messages logged by debug if the "Verbose" log level is enabled.
Output streams
By default debug will log to stderr, however this can be configured per-namespace by overriding the log method:
Example stdout.js:
var debug = require('debug');
var error = debug('app:error');

// by default stderr is used
error('goes to stderr!');

var log = debug('app:log');
// set this namespace to log via console.log
log.log = console.log.bind(console); // don't forget to bind to console!
log('goes to stdout');
error('still goes to stderr!');

// set all output to go via console.info
// overrides all per-namespace log settings
debug.log = console.info.bind(console);
error('now goes to stdout via console.info');
log('still goes to stdout, but via console.info now');
Extend
You can simply extend debugger
const log = require('debug')('auth');

//creates new debug instance with extended namespace
const logSign = log.extend('sign');
const logLogin = log.extend('login');

log('hello'); // auth hello
logSign('hello'); //auth:sign hello
logLogin('hello'); //auth:login hello
Set dynamically
You can also enable debug dynamically by calling the enable() method :
let debug = require('debug');

console.log(1, debug.enabled('test'));

debug.enable('test');
console.log(2, debug.enabled('test'));

debug.disable();
console.log(3, debug.enabled('test'));
print :
1 false
2 true
3 false
Usage :
enable(namespaces)
namespaces can include modes separated by a colon and wildcards.
Note that calling enable() completely overrides previously set DEBUG variable :
$ DEBUG=foo node -e 'var dbg = require("debug"); dbg.enable("bar"); console.log(dbg.enabled("foo"))'
=> false
disable()
Will disable all namespaces. The functions returns the namespaces currently enabled (and skipped). This can be useful if you want to disable debugging temporarily without knowing what was enabled to begin with.
For example:
let debug = require('debug');
debug.enable('foo:*,-foo:bar');
let namespaces = debug.disable();
debug.enable(namespaces);
Note: There is no guarantee that the string will be identical to the initial enable string, but semantically they will be identical.
Checking whether a debug target is enabled
After you've created a debug instance, you can determine whether or not it is
enabled by checking the enabled property:
const debug = require('debug')('http');

if (debug.enabled) {
  // do stuff...
}
You can also manually toggle this property to force the debug instance to be enabled or disabled.
Usage in child processes
Due to the way debug detects if the output is a TTY or not, colors are not shown in child processes when stderr is piped. A solution is to pass the DEBUG_COLORS=1 environment variable to the child process.
For example:
worker = fork(WORKER_WRAP_PATH, [workerPath], {
  stdio: [
    /* stdin: */ 0,
    /* stdout: */ 'pipe',
    /* stderr: */ 'pipe',
    'ipc',
  ],
  env: Object.assign({}, process.env, {
    DEBUG_COLORS: 1 // without this settings, colors won't be shown
  }),
});

worker.stderr.pipe(process.stderr, { end: false });
Authors
- TJ Holowaychuk
- Nathan Rajlich
- Andrew Rhyne
- Josh Junon
Backers
Support us with a monthly donation and help us continue our activities. [Become a backer]





Sponsors
Become a sponsor and get your logo on our README on Github with a link to your site. [Become a sponsor]









License
(The MIT License)
Copyright (c) 2014-2017 TJ Holowaychuk <tj@vision-media.ca> Copyright (c) 2018-2021 Josh Junon
Permission is hereby granted, free of charge, to any person obtaining a copy of this software and associated documentation files (the 'Software'), to deal in the Software without restriction, including without limitation the rights to use, copy, modify, merge, publish, distribute, sublicense, and/or sell copies of the Software, and to permit persons to whom the Software is furnished to do so, subject to the following conditions:
The above copyright notice and this permission notice shall be included in all copies or substantial portions of the Software.
THE SOFTWARE IS PROVIDED 'AS IS', WITHOUT WARRANTY OF ANY KIND, EXPRESS OR IMPLIED, INCLUDING BUT NOT LIMITED TO THE WARRANTIES OF MERCHANTABILITY, FITNESS FOR A PARTICULAR PURPOSE AND NONINFRINGEMENT. IN NO EVENT SHALL THE AUTHORS OR COPYRIGHT HOLDERS BE LIABLE FOR ANY CLAIM, DAMAGES OR OTHER LIABILITY, WHETHER IN AN ACTION OF CONTRACT, TORT OR OTHERWISE, ARISING FROM, OUT OF OR IN CONNECTION WITH THE SOFTWARE OR THE USE OR OTHER DEALINGS IN THE SOFTWARE.